Abstract
How does educational modality shape the social organization of student life? While the structural consequences of face-to-face versus screen-to-screen instruction have attracted scholarly attention, direct evidence on how this transition reshapes student social networks remains limited. Drawing on complete transcript records and network data from Korea University in 2019 (N=21,607) and 2020 (N=21,572), this paper analyzes co-enrollment networks before and after the shift to online education. The COVID-19 pandemic offers a rare quasi-natural experiment. Despite this disruption, the macrolevel architecture of co-enrollment networks proved resilient, preserving small-world properties with similar connectivity, clustering, and degree assortativity. Beneath this stability, however, online learning reorganized network formation; residential proximity and academic performance became stronger bases of assortative sorting, while disciplinary and cohort boundaries remained largely unchanged. Most strikingly, GPA-based assortativity increased even when self-evaluation-based assortativity declined, suggesting that online learning amplifies institutional measures of academic standing while eroding the social salience of students' subjective academic identities as an axis of sorting. These findings reveal a fundamental paradox. Rather than dissolving social boundaries, online education appears to have reinforced stratification along residential and performance lines.
-
Keywords: Social Network Analysis; Online Education; Course Enrollment Networks; E-learning; GPA; Self-evaluation; Network Assortativity
Introduction
In the wake of COVID-19, universities worldwide were abruptly compelled to abandon traditional modes of in-person instruction (
Mishra et al., 2020;
Pokhrel & Chhetri, 2021). As public health concerns escalated, universities shifted to primarily online-based virtual instructional models, with one study reporting that 40% of colleges adopted these models by the spring semester of 2021 (
Elias et al., 2021). There has been popular and scholarly interest in how this shift may have shaped academic outcomes including student engagement, learning gaps, and achievement (
Chakraborty et al., 2021). Although the cultivation of interpersonal relationships is a significant dimension of college life no less central to the educational experience than the acquisition of substantive knowledge (
Martin & Dowson, 2009;
Weeden et al., 2021;
Wentzel, 1999), understanding of the extent and mechanisms by which the transition to screen-to-screen environments affected this central dimension of higher education institutions remains limited. In this study, we address this question by investigating how the shift from in-person to online instruction may have reshaped the opportunities for social interaction.
Social scientists have long been interested in the function of higher education institutions in cultivating human capital and thereby shaping the structure of the stratification system in society (
Blau & Duncan, 1978;
Goldin & Katz, 2008). More recently, there has been growing recognition of how the experiential dimension of college education translates into social and cultural capital that plays a consequential role in social life (
Kingston et al., 2003;
Stevens et al., 2008). In this perspective, college life is understood as a transitional phase to a new social world marked by a relational web of new alters and ideas that leaves a lasting imprint (
Newcomb, 1961). Universities are powerful “social foci” in the lives of young adults, bringing students together around shared orientations and joint activities of both academic and nonacademic character (
Feld, 1981). The centrality of universities as a locus of social and cultural exchange became even more salient as enrollment rates increased globally and the ascendence of credentialism as a central status marker in contemporary society (
Collins, 2019;
Goldin & Katz, 2008).
Past studies have documented the active role of universities as institutional contexts for the formation of social ties. In a comprehensive study of the sources of friendship networks,
Thomas (2019) reports higher education as among the most salient sources of personal connection only comparable to that of the workplace. Universities have even been extensively studied as local marriage markets where young people find lifelong connections (
Kalmijn, 1998). Such a linking function, however, is not only confined to the strong ties of friendship and marriage but encompasses the wider sets of potential casual interactions that can take place spontaneously within college life. As such, it is important to address the question of the extent to which the institutional arrangements set by universities provide students with opportunities to have meaningful interactions with a heterogeneous set of students. While extant literature establishes the presence of network mechanisms including homophily or transitivity in predicting tie formation within university settings, there are only a few studies that empirically address the problem of compositional diversity in higher education (
Biancani & McFarland, 2013;
Mayer & Puller, 2008;
Ramsey et al., 2026).
Investigating the structure and composition of the networks in higher education has further implications for understanding key social outcomes including degree completion, career attainment, identity formation and lifestyle cultivation (
Martin et al., 2023;
Stevens et al., 2008;
Winston & Zimmerman, 2004). Recent studies have attended to understanding inequalities within higher education as precursors to future inequalities (
Cimpian et al., 2020;
Morgan et al., 2013). Peer effects and network integration have been empirically identified as predictors of academic performance in higher education across multiple settings (
Griffith & Rask, 2014;
Stadtfeld et al., 2019;
Winston & Zimmerman, 2004). As a result, systematic differences in how social networks are experienced in college may explain the achievement gap between social groups (
Ethier & Deaux, 1994). For instance,
Martin et al. (2023) find that female alumni of art-related majors had less social capital and fewer influential connections than their male counterparts. Other studies have identified network effects as contributing to the “leaky pipeline” in the so-called STEM fields, with women being exposed less to network environments that support them through degree completion and employment in relevant fields (
Raabe et al., 2019;
Weeden et al., 2020).
We treat the abrupt transition from face-to-face to online instruction as a rare quasi-experimental opportunity to examine how instructional modality shapes the relational networks that universities offer, using the exogenous shock of COVID-19 as the lever that made this otherwise unobservable comparison possible. These changes likely carry far-reaching implications for the attainment of social and cultural capital extending far beyond college life. There are reasons to expect changes in the structure and composition of student networks following the transition to online learning environments.
Lee et al. (2023)’s study reports an increase in political homophily in personal networks during COVID-19 and explains this pattern by enhanced possibility for self-selection with similar alters in mediated environments compared to institutionally imposed ones. It could be the case that the same logic also applies in universities if the former relational underpinning based on institutionally constrained physical copresence and propinquity gets replaced by one based on selection (
Festinger et al., 1950;
Small & Adler, 2019). However, as students possess multiple social attributes to potentially share with other students, which of these attributes function as the basis for self-selection also remains to be known. Therefore, we pose the following research questions.
RQ1: How does the transition from face-to-face to online instruction affect the macro-level topology of university student co-enrollment networks?
RQ2: How does the transition to online instruction alter the degree to which students sort along institutionally prescribed attributes—such as field of study and school year—versus socially embedded attributes such as residential origin and academic performance?
RQ3: How does the transition to online instruction affect the relative salience of objective versus subjective academic attributes as bases of assortative mixing in student co-enrollment networks?
We address these research questions through the analysis of a co-enrollment network of complete transcript data from Korea University combined with student data before (offline) and after COVID-19 (online). While higher education can be understood as an ensemble of multiple networks, co-enrollment networks are important in the sense that they are institutionally imposed and thus constitute the core dimension of academic life in students’ experience of college. Moreover, these networks not only function as pools from which stronger forms of social bonds may emerge but also shape the diversity of perspectives that students will be exposed to in the classroom environment. Empirical studies demonstrate that the structural features of co-enrollment networks are significant predictors of academic outcomes including persistence, grades, and degree completion (
Gardner et al., 2018;
Huerta-Manzanilla et al., 2021). As a result, recent proposals have highlighted the significance of understanding the contextual factors shaping the decision-making process of course-enrollment and the resulting macro-level network structure they create (
Bruch & Feinberg, 2017;
Kizilcec et al., 2023;
Malik et al., 2025).
More directly relevant to our research questions are a series of studies conducted by Weeden and colleagues (
Weeden & Cornwell, 2020;
Weeden et al., 2021). Their study addresses the question of the change in course enrollment networks after COVID-19 introduced hybrid instructional models to campus settings. Constructing two-mode bipartite networks (
Breiger, 1974) of students and courses based on the duality of persons and groups, they observe the structural change in the projected one-mode student-to-student network in Cornell University. As a result, they discovered that the small world structure of such a network in the fall semester of 2019 became less connected and more fragmented—especially by the field of study—as the hybrid instructional model took place. While this study provides a useful point of reference, the network that they build is still confined to the face-to-face network of students who were physically present as their central aim was to address the epidemiological implications of attending courses together in physical space. Our study takes a different strategy by investigating the co-enrollment network in its totality—both face-to-face in 2019 and screen-to-screen in 2020. Drawing on a direct comparison between fully face-to-face and fully online instructional environments, this study empirically examines how transitions in educational modality produce observable changes in the structure of student co-enrollment networks.
Empirical Setting: Data & Methods
Data
Korea University is a medium-sized private university located in Seoul, the capital city of South Korea. We restrict our analysis to the undergraduate programs located in Seoul, the main campus, and exclude exchange and graduate students at Korea University. We use complete transcript datasets that cover all undergraduate students except nursing and medical students enrolled in the spring and fall semesters of 2019 and 2020, respectively. We exclude nursing and medical students and their courses because their curricula are exclusive and restricted. Mandatory classes for all first‑year students, one‑credit experimental session classes, and Massive Open Online Courses (MOOCs) are dropped to avoid overestimation of students' connections. The final numbers of students used in our dataset enrolled in undergraduate courses on the Seoul campus are 21,607 and 21,572 in 2019 and 2020, respectively.
We analyze student attribute data including gender, school year, the grades for each course, Seoul Metropolitan Area (SMA) residency, and major (department information). In addition, subjective measures of how students evaluated their courses at the end of the semester were also included in our dataset. Among them, the average scores for two self-evaluation questions were used as a measure of course engagement: participation and invested effort. Each item was rated on a scale of 1–6, with higher scores indicating greater degrees. As a result, this dataset provides a unique opportunity to examine the relational structure of course enrollment networks along a wide range of individual attributes. The de-identified data used in this study were provided by the Korea University Data Information Center, and the study was approved by the Institutional Review Board at Korea University (KUIRB-2021-0299-01).
The Student-Class Bipartite Network
The annual course-taking of university students can be represented as a bipartite network (
Breiger, 1974) composed of two groups: students and classes. In a yearly bipartite network, the relationship between any two students is mediated by shared classes while the relationship between any two classes is defined by students who jointly enroll in them (
Israel et al., 2020;
Weeden & Cornwell, 2020). Because course enrollment patterns vary across semesters, we aggregate the student enrollment data of two semesters within a year to construct yearly bipartite co-enrollment networks. Basic statistics are shown in
Table 1.
We first investigate some basic properties of the bipartite networks for two academic years.
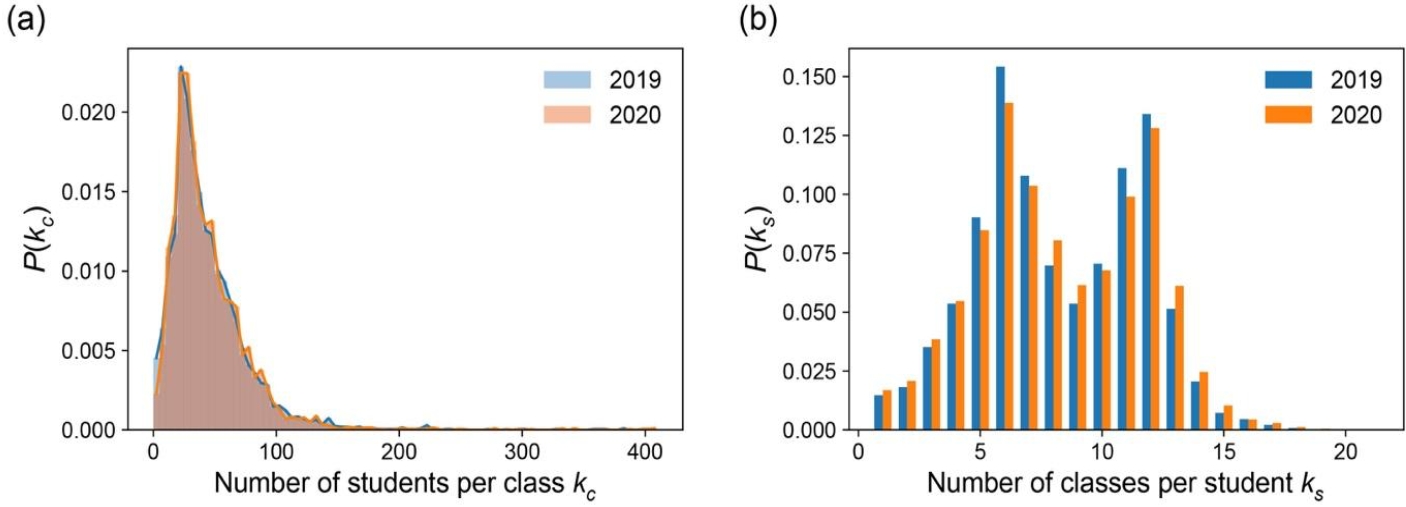
Figure 1(a) and
(b) show the probability distribution of the number of students per class (or the degree distribution of the classes) and the distribution of the number of classes taken per student (or the degree distribution of the students) in the bipartite networks. We find that the two distributions have very similar characteristics. In 2019 (2020), a total of 21,607 (21,572) students participated in 4,058 (4,072) classes. The average number of students per class was 44 (median: 36) in both years, and the largest class size was 400 and 410, respectively. The average number of classes taken per student was 8.3 (median: 8) for both years, and the maximum number of classes taken by a student was 20 and 21 for 2019 and 2020, respectively.
This stability suggests that the aggregated enrollment structure over the two semesters provides a well-controlled setting for subsequent analyses, allowing us to examine changes in sub-level differences and connectivity patterns while holding macroscopic conditions effectively constant.
Characteristics of the Student Co-Enrollment Networks
To assess the structure of the student co-enrollment networks, we project the bipartite network onto the student layer. In the simple projection, all students who participate in the same class are connected. This yields a weighted co-enrollment network in which nodes represent students and edge weights correspond to the number of classes shared between pairs of students.
Table 2 summarizes the macroscopic network properties of the two co-enrollment networks. The largest connected component of the co-enrollment network of students in 2019 (2020) consists of 21,604 (21,568) nodes and 4,790,268 (4,755,093) links. The density is approximately 0.02 in both years, and the diameter is 4 and 5 for 2019 and 2020, respectively. These values are comparable to those reported for a U.S. university of similar size (
Weeden et al., 2021). Most students are connected within a few steps in the co-enrollment network, as reflected by the small diameters. The two networks also exhibit high clustering coefficients (0.38 for both years) and positive degree assortativity (0.29 and 0.27, respectively).
Similar to the case of the bipartite network, the overall statistics of the one-mode network in both years are highly similar across multiple attributes. However, this apparent stability may stem from the simplicity of the projection method, which does not account for the significance of links. In particular, the simple one-mode projection of the student–class bipartite network ignores degree heterogeneity among both students and classes. As a result, all students enrolled in the same class are fully connected, generating many links that may arise purely by chance. This effect is reflected in the unusually high average degree (greater than 440) and relatively high link density observed in the student networks (
Table 2).
To address this limitation of the simple projection method, we employ a statistical validation framework proposed by
Tumminello et al. (2011), which explicitly accounts for degree heterogeneity in the bipartite network. The main idea is to assess the statistical significance of link weights by comparing them against a null model.
Given a bipartite network consisting of a student set S and a class set C, we denote the set of students with degree k as Sk. We consider a null model in which students are assigned to classes at random while preserving their degree (i.e., the number of classes taken by each student). Under this assumption, the probability that two students i and j share X common classes in the class set C follows a hypergeometric distribution:
where NC is the total number of classes, and Ni and Nj denote the degrees of students i and j, respectively. If students i and j share Ni,j classes, then the probability of observing at least this many shared classes under the null model is given by:
This represents the probability that two students share more than
Ni,j classes purely by chance. If
p(
Ni,j ) is smaller than a chosen significance level, the null hypothesis that the link between two students arises by chance can be rejected. Because this test is performed for a large number of student pairs, multiple hypothesis correction is required. We therefore apply two standard correction methods: (i) false discovery rate (FDR), which controls the expected proportion of false positives among the detected links, and (ii) Bonferroni correction, which more conservatively controls the probability of any false positive (
Tumminello et al., 2011). In large-scale networks, Bonferroni correction can be overly stringent, leading to excessive loss of meaningful links, whereas FDR offers a more balanced trade-off between sensitivity and false discovery control.
Table 3 shows the representative network characteristics of the three networks: the original one-mode networks (Original-Net), student networks with FDR correction (FDR-Net), and student networks with Bonferroni correction (Bonferroni-Net). Original-Net is an adjacency network obtained from a simple one-mode projection of the bipartite network. FDR-Net is a subnetwork of the original adjacency network composed of statistically validated links (FDR correction, α = 0.01). Bonferroni-Net uses Bonferroni correction. FDR-Net preserves most nodes while substantially reducing insignificant links. More than 99.7% of nodes are connected in the largest component. Here, we set the significance level for the multiple hypothesis testing as α = 0.01 for both corrections. Among the resulting networks, we found that the FDR correction method offers the most intuitive and meaningful result. FDR-Nets are composed of a similar number of nodes (students) to the original network while substantially reducing the insignificant links. Moreover, almost all nodes (99.7%) of the FDR-Nets belong to the largest connected component. On the other hand, the Bonferroni-Net loses more than 40% of the nodes of the Original-Net and is highly fragmented into 614 and 709 communities for each year, respectively. Therefore, we take FDR correction for the main analysis.
Assortativity in Student Attributes
To quantify assortative mixing across student attributes before and after the transition to the online platform, we measure the assortativity coefficients on the yearly student co-enrollment networks.
The assortativity coefficient for discrete variables is defined as follows (
Newman, 2003). Let
e be the matrix whose element
eij represents the fraction of edges connecting nodes of type
i and
j. It satisfies the sum rule: ∑
eij = 1. Defining
ai and
bi as
ai = ∑
jeij and
bj = ∑
ieij , the assortativity coefficient is defined as:
Where Tr e denotes the trace of e, and ‖e2‖ represents the sum of all elements of the matrix e2. This formulation provides a compact matrix representation of the expected level of random mixing. The measure satisfies r = 0 when there is no assortative mixing, and r = 1 under perfect assortative mixing. If the network is perfectly disassortative, then r becomes negative with minimum value rmin=−∑iaibi1−∑iaibi, which lies in the range -1 ≤ r < 0.
By analogy with the discrete case, the assortativity coefficient for continuous node attributes is defined as:
where
exy satisfies the sum rule,
ax and
by are the fractions of edges starting and ending at nodes with attributes
x and
y, and
σa and
σb are the standard deviations of the corresponding distribution.
r is in the range -1 ≤
r ≤ 1, with
r = 1 indicating perfect assortativity and
r = -1 indicating perfect disassortativity (
Newman, 2003).
Results
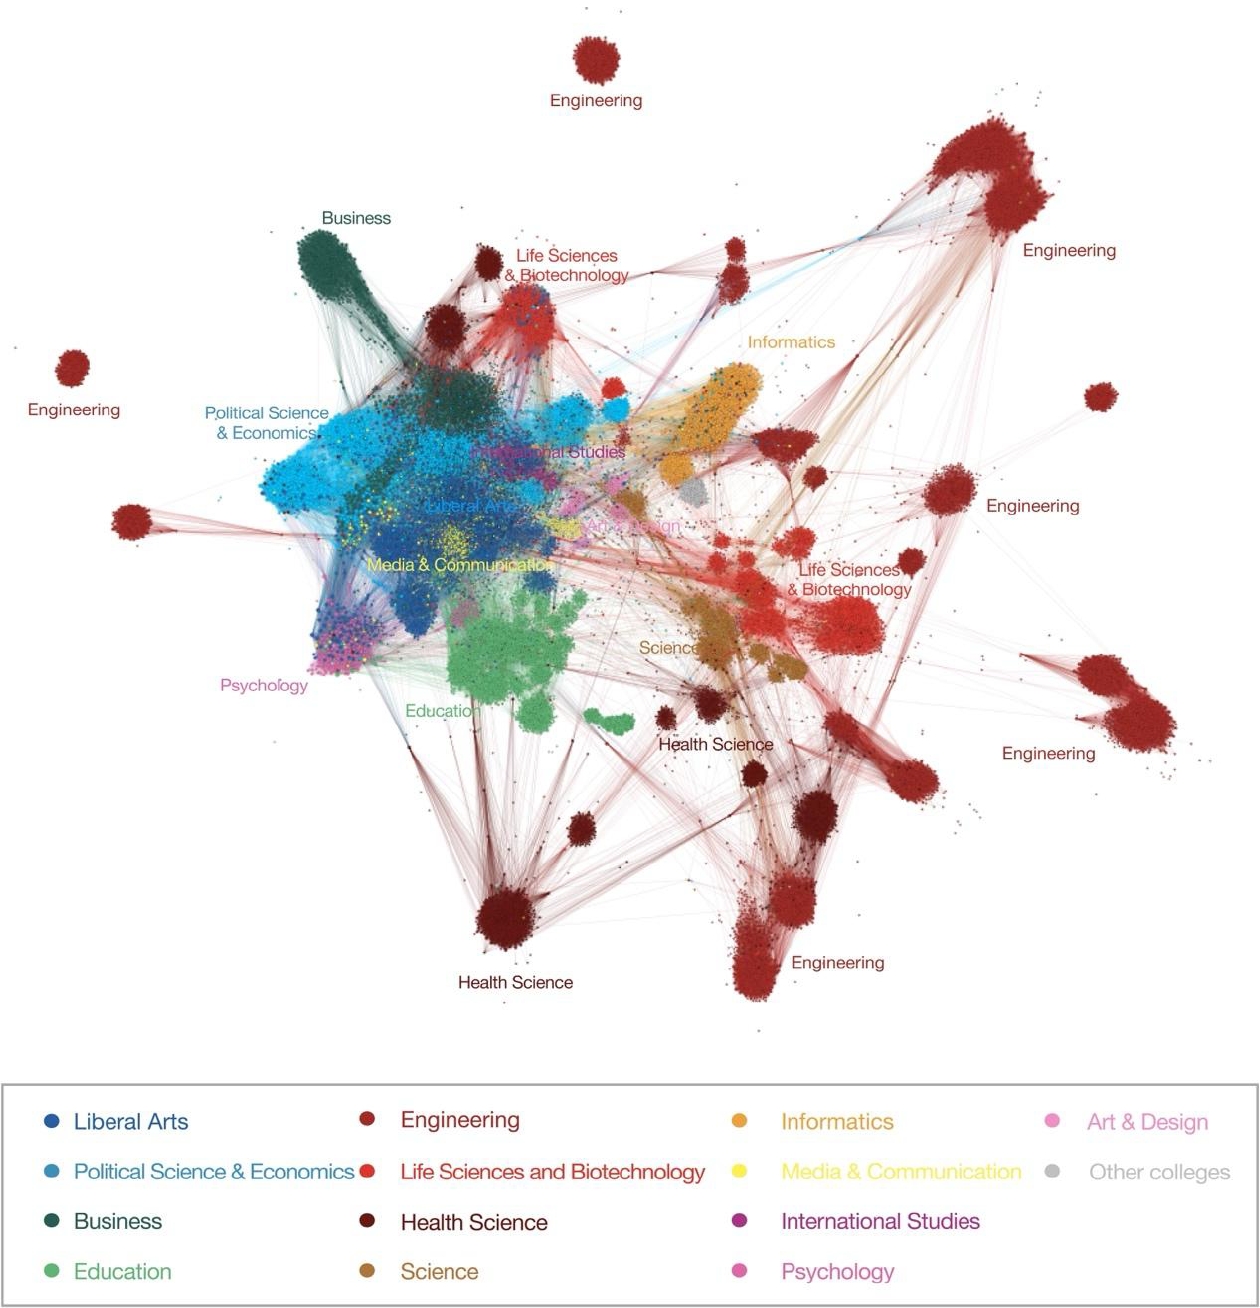
Figure 2 visualizes the entire FDR-Net of the university students in 2019 where the nodes are colored according to colleges. The visualized FDR-Net exhibits a clear clustering structure based on colleges. The layout is generated using a force-directed algorithm and includes 21,531 students and 864,113 links. Node size is proportional to degree, and edges represent shared class enrollment. Node colors indicate the college to which the student's major belongs. For visualization purposes, only links with weight ≥ 3 are shown (~36.9% of links). Substructures are visible within colleges, reflecting their internal departmental organization. For example, the College of Engineering exhibits several tightly clustered subgroups.
‘Small-World’ Characteristics of the FDR-Nets
We compare the two FDR-Nets to examine whether the transition to online instruction altered the connectivity structure of student co-enrollment networks. Despite substantial link filtering, which retains only statistically significant links, the two networks exhibit strikingly similar macroscopic connectivity patterns (
Table 4). This suggests that the overall connectivity structure induced by course enrollment remains stable across learning environments, provided that the opportunity for course selection is preserved.
To characterize these structural properties, we analyze standard network measures and compare them with randomized counterparts. Specifically, for each year, we generate 10 randomized networks using a double-swap procedure that preserves the degree distribution, number of nodes, and number of links (
Table 4). Basic network properties (†) are preserved by construction in the randomized networks.
Both yearly FDR-Nets display hallmark features of small-world networks (Watts & Strogatz, 1998), including short path lengths and high clustering coefficients. The observed diameters (10 and 11) are larger than those of the randomized networks (5.6 and 5.5) but similar to
Weeden et al. (2021)’s findings (9 and 10), while the clustering coefficients (0.489 and 0.488) are substantially higher than the randomized baseline (~0.01). These patterns confirm the presence of strong local clustering combined with global connectivity.
In addition, the degree assortativity coefficients remain consistently positive (0.484 and 0.499), a characteristic commonly observed in social networks (
Barabási, 2013). Overall, the macroscopic properties of the co-enrollment networks remain highly similar across the two years, indicating that the small-world structure is robust to the transition to fully online learning. These findings are consistent across different significance thresholds used in constructing the FDR-Nets (
α = 0.001,0.005,0.01).
The absence of substantial changes in network properties suggests that the macro-level structure of co-enrollment networks is primarily shaped by institutional course organization, rather than by the mode of education. Our results contrast with prior findings from hybrid learning environments (
Weeden et al., 2021), where student networks became more fragmented and exhibited increased path lengths following COVID-19. Such fragmentation may have been driven by constraints on class size and reduced in-person interactions. It is worth noting that Cornell University did not transition entirely to online instruction; rather, the comparison between pre- and post-COVID-19 periods took place under a hybrid format that combined in-person and remote learning (
Weeden et al., 2021). This partial shift to online delivery may have affected students' course enrollment networks differently than a complete, mandatory transition to fully online instruction would have. In contrast, the case of Korea University with a complete transition to online instruction maintained comparable structural characteristics.
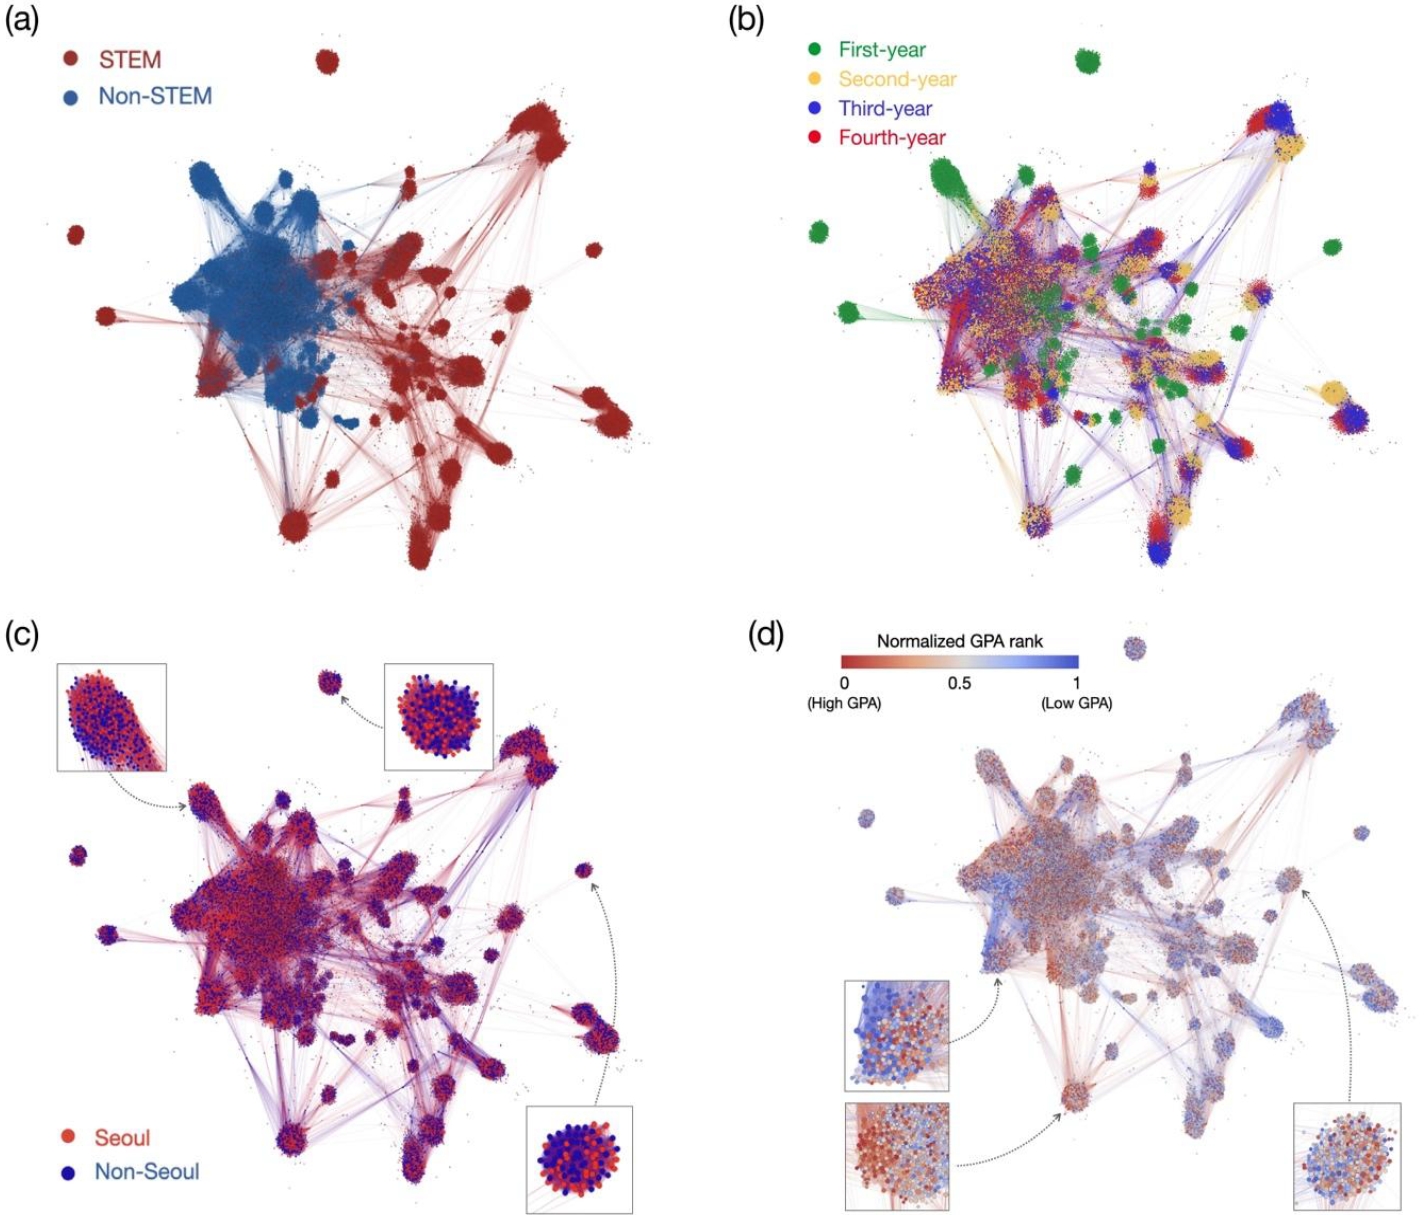
Notwithstanding the relative stability observed in the macro-level connectivity of co-enrollment networks, the micro-level structure of these networks reveals meaningful shifts in patterns of assortative mixing with respect to student attributes. Using student metadata, we examine how individuals are positioned in the network with respect to student attributes such as STEM/Non-STEM, college, school year, gender, current residence, hometown origin, average GPA rank (computed within each year based on students’ mean GPA), and average self-evaluation rank. Visual inspection of the yearly co-enrollment networks suggests that students tend to form clusters aligned with these attributes (
Figures 2 and
3). The students (nodes) are grouped (a) by STEM and Non-STEM majors, (b) by school years, (c) by current residence, and (d) by normalized average GPA rank. The rank of yearly GPA is normalized from 0 to 1, with 0 being the highest ranking (higher GPA). In particular, strong clustering is observed at the level of college affiliation (
Figure 2). At a coarser level, grouping departments into STEM and Non-STEM categories reveals a clear separation between these two groups in the network (
Figure 3a). Beyond academic attributes, clustering patterns are also observed for school year, current residence, average GPA rank (
Figure 3b–
d).
To quantify these patterns observed in FDR-Nets, we compute assortativity coefficients (
Newman, 2003) for each attribute across the two years. Numeric assortativity is used for continuous variables (normalized GPA rank and self-evaluation rank), while discrete assortativity is used for categorical attributes.
Table 5 reports the assortativity coefficients for the two yearly FDR-Nets. The relative difference is defined as the ratio of the absolute change in assortativity to the previous year’s value. Among the attributes, students’ current address and average GPA rank show the largest relative differences in assortativity. Consistent with the visual patterns, all attributes exhibit positive assortativity, indicating that connections in the network are more likely to occur between students with similar characteristics. This pattern is broadly consistent with prior findings that social relationships tend to align along shared attributes (
McPherson et al., 2001), although it should be interpreted as observed assortative mixing in course enrollment rather than direct evidence of preference-driven homophily, likely arising from a combination of institutional constraints and underlying social processes.
We note that because the student attributes are not independent, the magnitude of assortativity coefficients varies across attributes. For example, assortativity in gender or residence is relatively low compared to that of college or school year, yet remains substantially higher than the values observed in the randomized networks.
Table 5 shows that both the mean and standard deviation of assortativity coefficients in the randomized networks are close to zero, indicating that the observed patterns are unlikely to arise by chance.
Despite the stability of the overall network structure, assortativity patterns are not constant across years. Examining relative differences, we find that certain attributes exhibit notable changes following the transition to online instruction. Assortativity associated with individual-level or performance-related attributes shows larger shifts. For example, assortativity for current residence and average GPA rank increases by 37.2% and 21.3%, respectively, whereas institutionally structured attributes such as STEM/Non-STEM, college, and school year remain relatively stable or decrease slightly. In contrast, assortativity based on average self-evaluation rank decreases by approximately 21.3%. That is an intriguing finding, especially when juxtaposed with the increase in GPA-based assortativity.
Finally, we verify that these patterns are robust across alternative network constructions. Repeating the analysis using FDR-Nets with different significance thresholds yields similar results (
Table S1), indicating that the observed changes in assortativity are not sensitive to the specific network construction method.
The subgroup analysis presented in
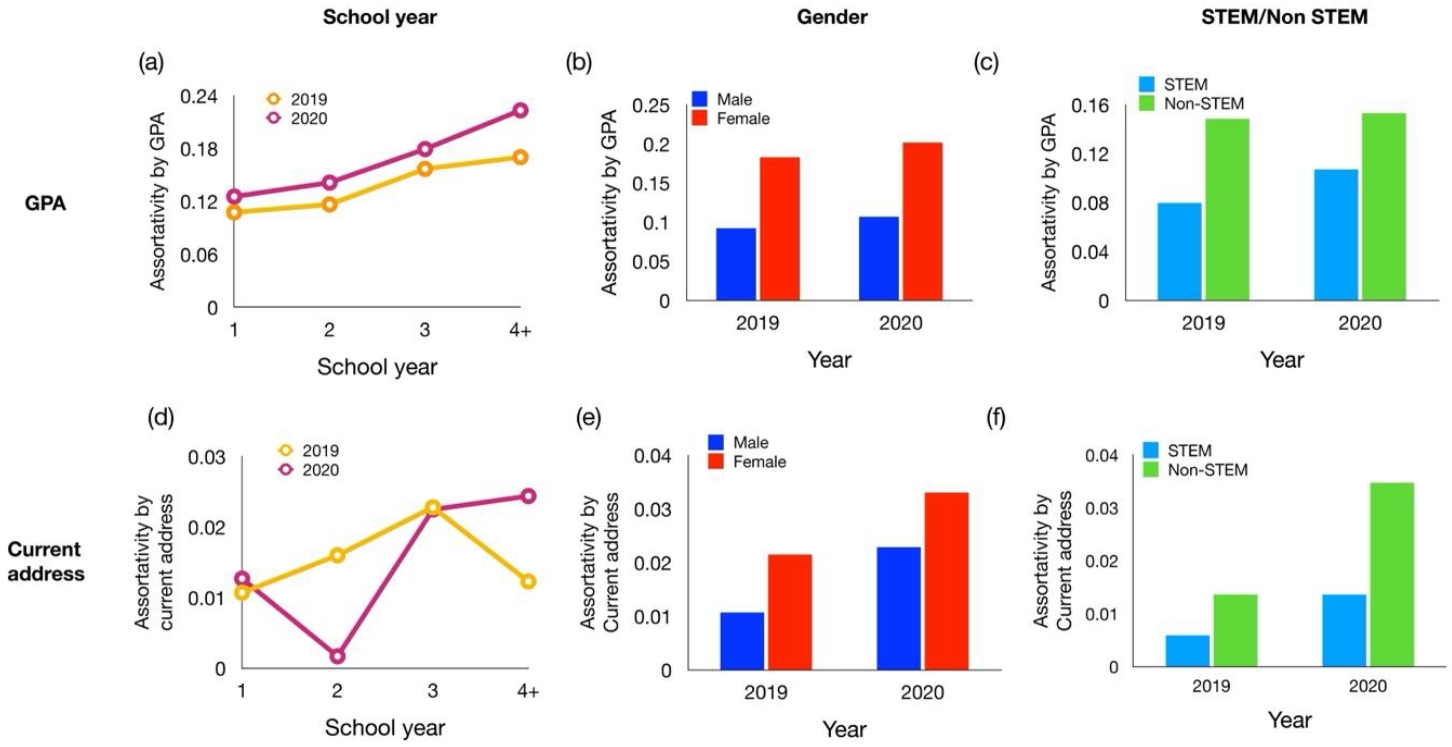
Figure 4 provides further insight into the observed changes in assortativity.
Figure 4(a)–
(c) shows that GPA-based assortativity consistently increases across different subgroups, including school year, gender, and STEM/Non-STEM categories, indicating that performance-based clustering becomes more pronounced in the online learning environment.
More specifically, when subnetworks are constructed by school year (
Figure 4a), GPA-based assortativity exhibits an increasing trend with respect to grade level in both years, with consistently higher values observed in 2020. One possible explanation is that students in higher grades tend to take more specialized or difficult courses, leading to stronger clustering among students with similar academic performance. In addition, older students with lower academic performance may be more likely to retake courses, which could further reinforce stratification by performance. Notably, the increase in GPA-based assortativity is observed across school years, with an average increase of approximately 21%, and the largest increase (31%) occurring among students in their fourth year or above.
When examining gender-based subnetworks (
Figure 4b), female students exhibit approximately twice the level of GPA assortativity compared to male students in both years, while both groups show a slight increase following the transition to online learning. Similarly, in the comparison between STEM and Non-STEM students (
Figure 4c), Non-STEM students show higher assortativity in both periods; however, the relative increase in assortativity is larger among STEM students. Taken together, these results indicate that GPA-based assortativity increased across all subgroups, suggesting a general strengthening of performance-based clustering under online instruction.
In contrast,
Figures 4(d)–
(f) show that the patterns of assortativity based on current residence are more heterogeneous across subgroups. Unlike the case of GPA, no clear trend is observed across school years (
Figure 4d). However, subgroup differences emerge when considering gender and academic fields. Female students show higher residence-based assortativity in both years, but the relative increase is larger among male students (113% for males compared to 54% for females) (
Figure 4e). In addition, Non-STEM students exhibit both higher absolute levels and larger increases in residence assortativity compared to STEM students (
Figure 4f), with increases of 153% and 132%, respectively.
Taken together, these findings suggest that while GPA-based assortativity increases consistently across all subgroups, residence-based assortativity varies more depending on subgroup characteristics. The results indicate that the transition to online learning strengthens performance-based clustering in a relatively uniform manner, while locality-based assortativity is shaped by subgroup-specific dynamics. These subgroup-level differences highlight how environmental changes associated with online learning can differentially affect patterns of social mixing across student populations. The underlying mechanisms driving these differences remain an important direction for future research.
Discussion and Conclusion
Universities are not merely sites of learning—they are relational infrastructure that engineer the conditions under which students cross paths and form ties (
Stevens et al., 2008). This study asks what happens to that infrastructure when the physical classroom disappears. On the structural level, we find remarkable stability and persistence. The co-enrollment network held its shape, preserving the small-world properties of connectivity and clustering that characterize robust social systems. This stands in contrast to prior work on hybrid learning environments, which documented growing fragmentation (
Weeden et al., 2021); full online transition, it turns out, may operate by a different mechanism. Equally notable is the persistence of disciplinary boundaries as organizing axes of the network, suggesting that institutional structure proved more durable than physical space—the skeleton of academic life remained standing even when its flesh was stripped away.
On the compositional level, however, we find dynamic reconfiguration of the dimensions along which student networks are constructed. Increased assortativity in residence and academic performance indicates a strengthening of locality- and performance-based clustering, even in environments that are often assumed to reduce spatial constraints. One might intuitively expect online learning to dissolve geographic boundaries—after all, if everyone is logging in from wherever they are, physical location should no longer matter. Yet the finding suggests the opposite: the removal of the shared campus space actually deepened the divide between metropolitan and non-metropolitan students, as if the physical classroom had been quietly serving as a social equalizer all along. When that common ground disappeared, students retreated into geographically homogeneous clusters, making residential origin a more, not less, consequential axis of social sorting.
At the same time, the divergence between increased GPA-based assortativity and decreased self-evaluation-based assortativity points to a potential decoupling between objective academic performance and students’ subjective self-assessment in online settings. This divergence suggests that online learning environments may amplify objective performance-based alignment while weakening the alignment between students’ self-evaluation and their academic performance, potentially reflecting reduced opportunities for peer interaction through which students calibrate their self-assessment.
The decline in self-evaluation-based assortativity under online learning may reflect a broader decoupling of subjective academic identity from the social organization of course-taking. In face-to-face settings, students navigate course selection through a rich ecology of informal peer signals—classroom dynamics, study group affiliations, and reputational cues—that align co-enrollment patterns with how students perceive themselves academically. Online learning strips away this social infrastructure, severing the informal channels through which similarly self-perceiving students ordinarily find one another. Compounding this, the gravitational pull of high-enrollment or structurally convenient courses may draw students across the self-evaluation spectrum into the same virtual classrooms, mechanically eroding the sorting power of subjective self-assessment. Taken together, these dynamics point to a revealing asymmetry: as online learning weakens the social salience of how students see themselves, it simultaneously amplifies the sorting power of how institutions measure them—a shift from subjective identity to objective credential as the dominant axis of academic stratification.
Overall, our results highlight that increased accessibility in online education does not necessarily translate into more diverse or integrated patterns of interaction. Instead, online environments may reinforce certain dimensions of similarity while maintaining the broader structural properties of the network. This implies that even when structural opportunities for interaction remain intact, the actual patterns of student mixing can shift in ways that reshape exposure to diverse peers, highlighting a potential gap between structural accessibility and realized interaction patterns.
Lastly, the finding that assortativity varies along some dimensions but not others sheds light on how institutional and relational constraints shape microlevel decision-making processes. Course-taking is heavily guided by requirements based on disciplines and cohorts and this institutional constraint was found to be less sensitive to the shift to an online learning environment. On the other hand, assortativity based on less institutionally bound but more relationally embedded dimensions of residence, GPA, and course evaluation exposed substantial sensitivity. This leads to a conceptualization of the course-taking decision to be an outcome of both institutional constraints and social embeddedness (
Zukin & DiMaggio, 1990). Our case illuminates a process where the former remained intact while the latter exposed significant sensitivity, given the nature of the responses to the pandemic. We suggest that conceptualizing decision-making processes as doubly embedded in institutions and social networks will provide a useful lens to understand how the micro-level actions that constitute the larger social structure may respond in the wake of social pressures, both endogenous and exogenous (
Brunch & Feinberg, 2017).
Several limitations should be noted. First, universities harbor social networks in a multitude of modes other than course-taking including informal social networks through extracurricular activities and faculty-student relationships. How these more informal and mostly offline networks interact with enrollment networks and how the transition to online environments may have differently affected each network is an important question to be addressed in future studies. Second, we assume that co-enrollment provides similar opportunities for social interaction and ideational exchange in both face-to-face and screen-to-screen modalities. However, it is plausible that important qualitative differences exist between them, an issue we were unable to assess with our dataset. Finally, our findings are based on the specific context of a case study in a Korean university. Yet, the research questions and the social processes underlying our findings have broader relevance. Future research may examine how similar transitions alter network topology and composition in other contexts where social cleavages are structured in alternative ways, such as race and region in the United States.
Supplementary Information
Notes
Fig. 1.
Characteristics of Student-Class Bipartite Network
Notes: (a) Probability distribution of the number of students per class. (b) Probability distribution of the number of classes per student.
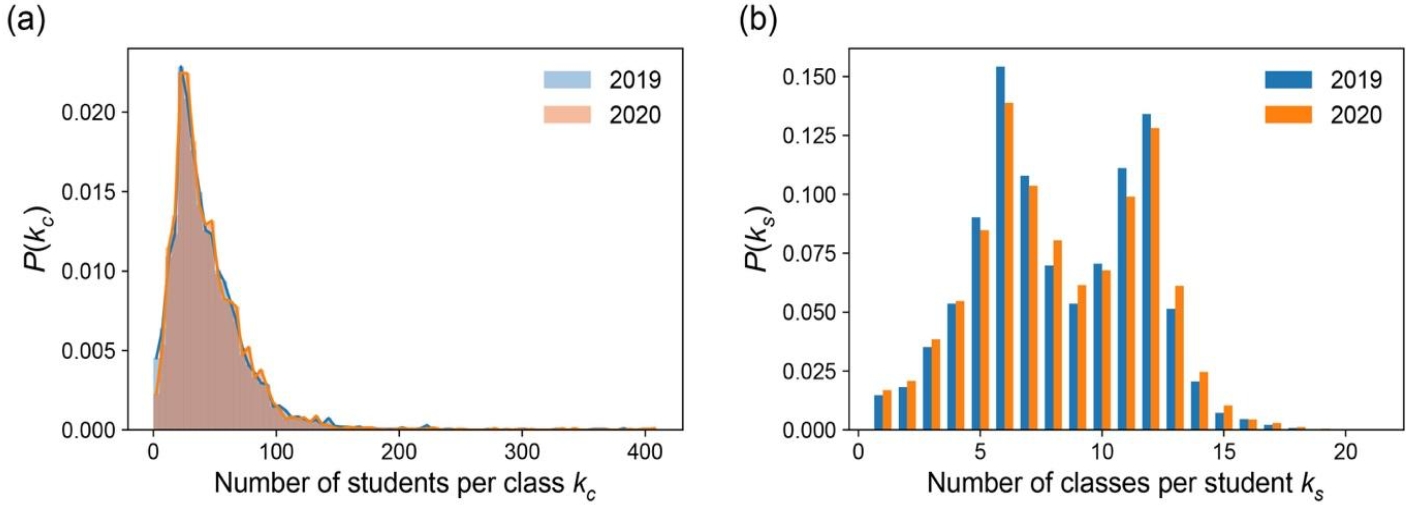
Fig. 2.Visualization of the Student Co-Enrollment Network (FDR-Net)
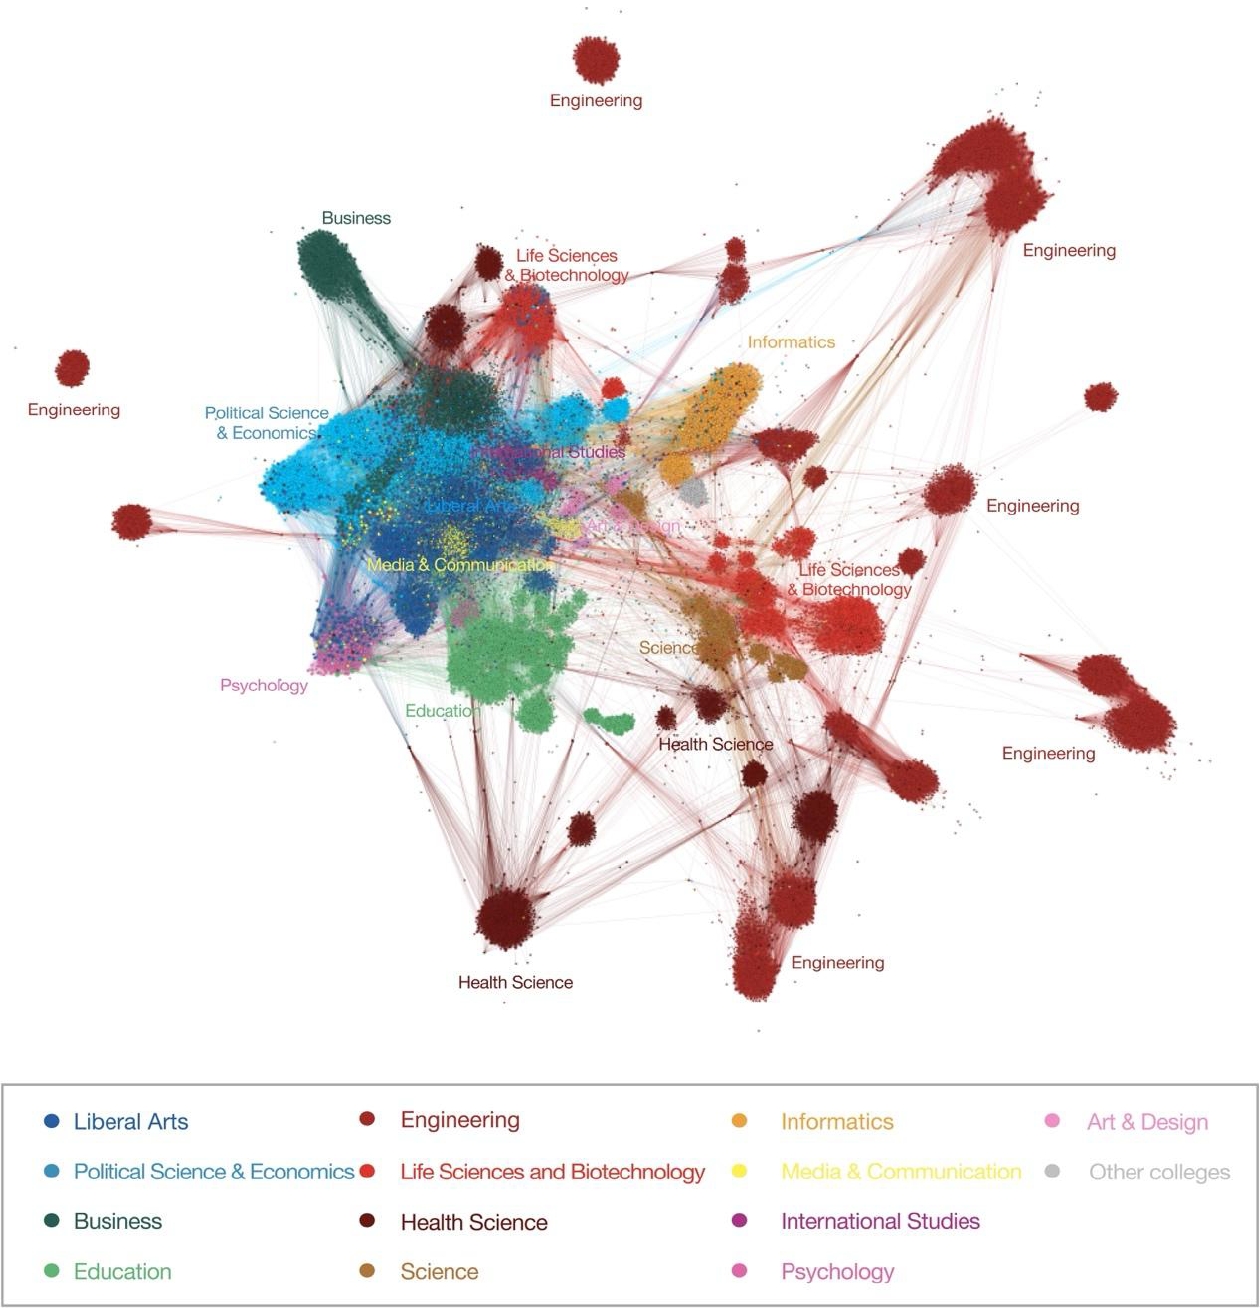
Fig. 3.The Co-Enrollment Network in 2019 according to Four Student Attributes
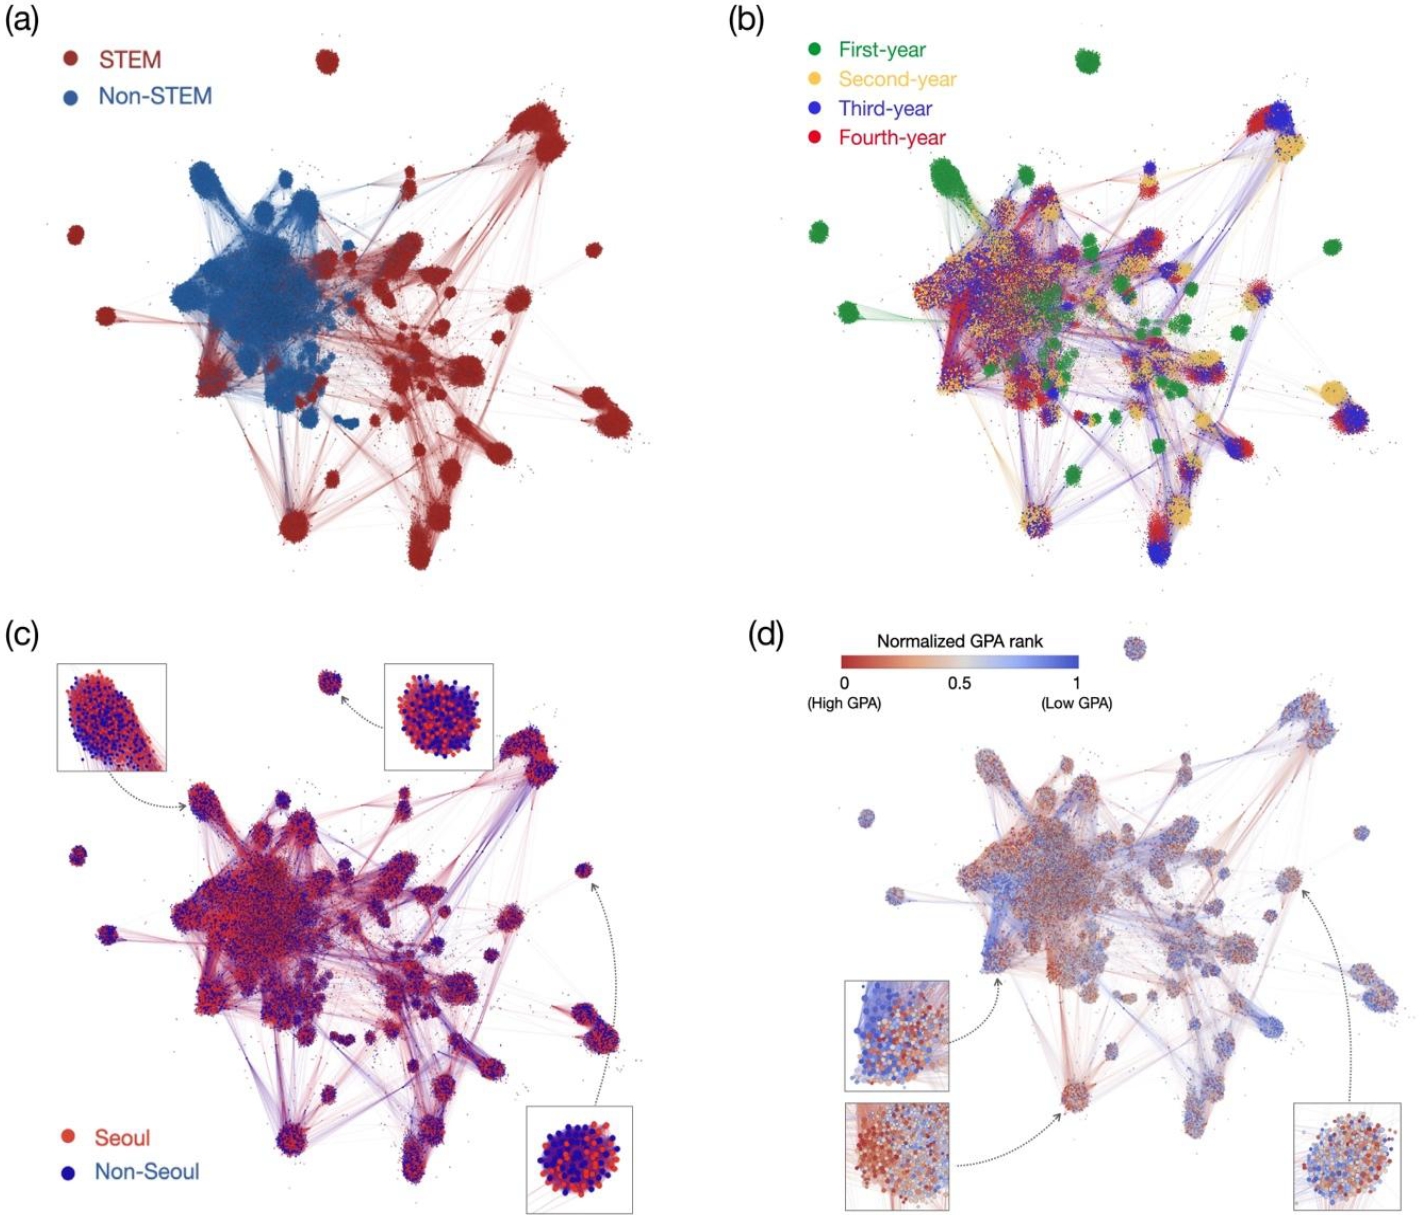
Fig. 4.
Assortativity by GPA and Residential Area in Subnetworks
Notes: (a) GPA assortativity increases with school year, with higher values observed in 2020. (b) Females exhibit higher GPA assortativity than males, with values further increasing in 2020. (c) Non-STEM students show higher GPA assortativity than STEM students; both groups exhibit an increase in 2020. (d–f) Assortativity in current residential area. (d) No clear trend is observed across school years. (e) Females show higher residence assortativity than males; both groups exhibit an increase in 2020. (f) Non-STEM students show higher residence assortativity with a larger increase in 2020.
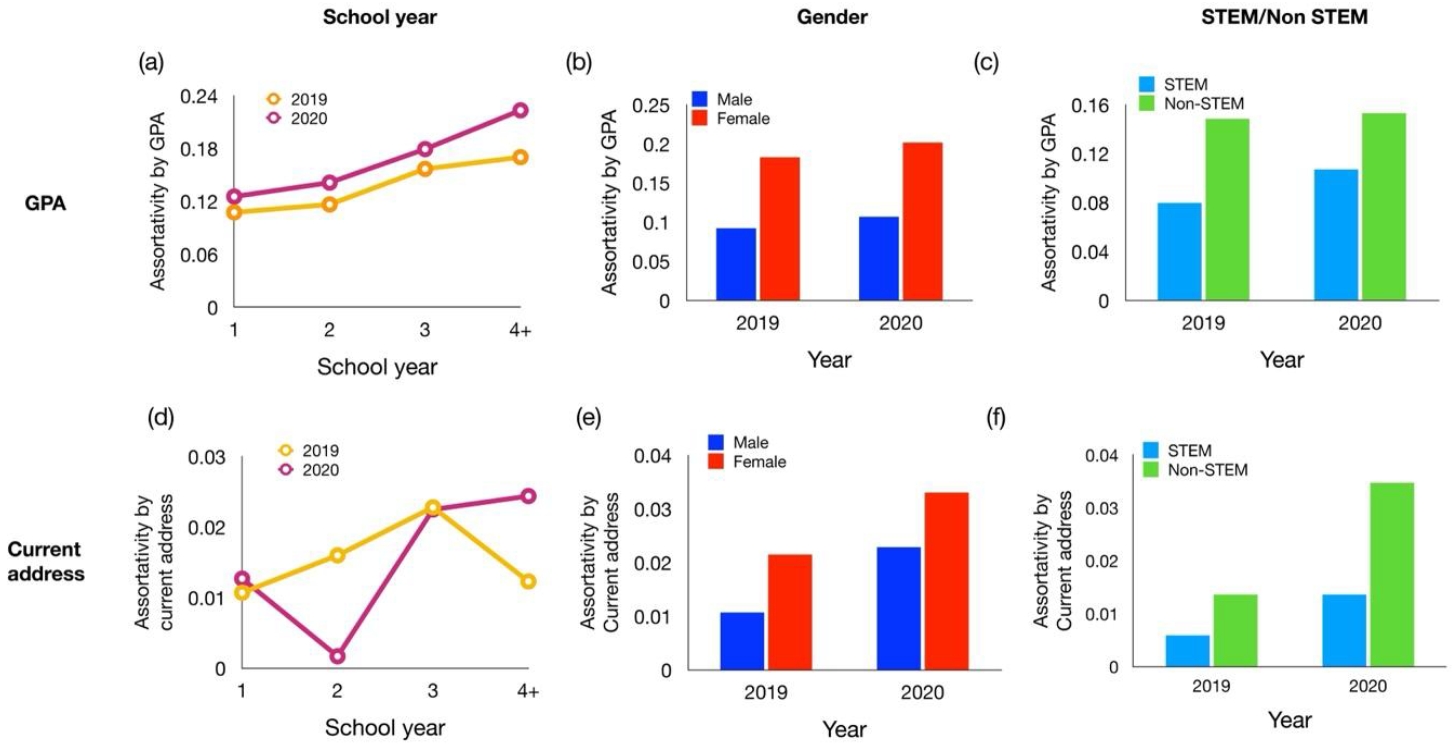
Table 1.Basic Statistics of Class Enrollment Data
Table 1.
|
Network characteristics |
2019 |
2020 |
|
Number of students |
21,607 |
21,572 |
|
Number of classes |
4,058 |
4,072 |
|
Average (median) # of students per class |
44.06 (36) |
44.1 (36) |
|
Maximum # of students per class |
400 |
410 |
|
Average (median) # of classes per student |
8.27 (8) |
8.33 (8) |
|
Maximum # of classes per student |
20 |
21 |
|
Majors |
Proportion (%) |
Proportion (%) |
|
Business |
11.9 |
11.6 |
|
Liberal Arts |
19.9 |
19.7 |
|
Life Sciences and Biotechnology |
8.4 |
8.3 |
|
Political Science & Economics |
12.3 |
12.0 |
|
Science |
3.9 |
3.9 |
|
Engineering |
16.9 |
17.0 |
|
Education |
8.2 |
8.3 |
|
Health Science |
7.1 |
7.2 |
|
Informatics |
3.3 |
3.3 |
|
International Studies |
1.8 |
2.0 |
|
Art & Design |
1.2 |
1.4 |
|
Media & Communication |
3.0 |
2.9 |
|
Smart Security |
0.5 |
0.5 |
|
Psychology |
1.3 |
1.7 |
|
Other |
0.2 |
0.3 |
Table 2.Network Structure of the Student Co-Enrollment network (Simple One-Mode Projection)
Table 2.
|
Network properties |
2019 |
2020 |
Difference |
Relative Difference (%) |
|
# Nodes |
21,604 |
21,568 |
-36 |
-0.17 |
|
# Links |
4,790,268 |
4,755,093 |
-35,175 |
-0.73 |
|
Density |
0.0205 |
0.0204 |
-0.0001 |
-0.49 |
|
Average degree |
443.5 |
440.9 |
-2.6 |
-0.59 |
|
Median degree |
392 |
398 |
6 |
1.53 |
|
Diameter |
4 |
5 |
1 |
25.00 |
|
Clustering Coefficient |
0.38 |
0.38 |
0 |
0.00 |
|
Degree assortativity |
0.287 |
0.267 |
-0.02 |
-6.97 |
Table 3.Results of the Three Approaches for the Construction of Co-Enrollment Networks
Table 3.
|
Network |
Year |
# Students |
# Links |
# Connected components |
Largest component size |
|
Original-Net |
2019 |
21,606 |
4,790,269 |
2 |
21,604 |
|
2020 |
21,570 |
4,755,094 |
2 |
21,568 |
|
FDR-Net |
2019 |
21,535 (99.7%) |
864,115 |
3 |
21,531 |
|
2020 |
21,504 (99.7%) |
843,190 |
5 |
21,496 |
|
Bonferroni-Net |
2019 |
12,616 (58.4%) |
94,413 |
709 |
7,007 |
|
2020 |
12,047 (55.9%) |
94,798 |
614 |
7,550 |
Table 4.Small-World Properties of the Yearly Co-Enrollment Networks with FDR Correction (FDRNet)
Table 4.
|
Network properties |
2019 |
2020 |
Difference |
Relative Diff. (%) |
2019 Random (std.) |
2020 Random (std.) |
|
# Nodes |
21,531 |
21,496 |
-35 |
-0.16 |
21,531†
|
21,496†
|
|
# Links |
864,113 |
843,186 |
-20,927 |
-2.42 |
864,113†
|
843,186†
|
|
Density |
0.004 |
0.004 |
0 |
0.00 |
0.004†
|
0.004†
|
|
Average degree |
80.3 |
78.5 |
-1.8 |
-2.24 |
80.3†
|
78.5†
|
|
Median degree |
67 |
66 |
-1 |
-1.49 |
67†
|
66†
|
|
Diameter |
10 |
11 |
1 |
10.00 |
5.6 (0.49) |
5.5 (0.50) |
|
Clustering Coefficient |
0.489 |
0.488 |
-0.001 |
-0.20 |
0.01 (0.0) |
0.01 (0.0) |
|
Degree assortativity |
0.484 |
0.499 |
0.015 |
3.10 |
0.00 (0.0) |
0.0 (0.0) |
Table 5.Assortativity by various student attributes in the yearly co-enrollment networks (FDR-Nets)
Table 5.
|
Attributes |
2019 |
2020 |
Difference |
Relative Diff. (%) |
2019 Random (std.) |
2020 Random (std.) |
|
STEM |
0.859 |
0.858 |
-0.001 |
-0.12 |
-0.0003 (0.0015) |
-0.0004 (0.0011) |
|
College |
0.747 |
0.746 |
-0.001 |
-0.14 |
0.0000 (0.0003) |
-0.0001 (0.0005) |
|
School year |
0.405 |
0.382 |
-0.023 |
-5.62 |
-0.0003 (0.0005) |
-0.0001 (0.0005) |
|
Gender |
0.169 |
0.171 |
0.002 |
1.39 |
-0.0004 (0.0007) |
-0.0001 (0.0005) |
|
Current residence |
0.019 |
0.026 |
0.007 |
37.22 |
-0.0000 (0.0012) |
0.0003 (0.0014) |
|
Hometown origin |
0.02 |
0.019 |
-0.001 |
-6.34 |
-0.0001 (0.0008) |
-0.0003 (0.0011) |
|
GPA rank |
0.136 |
0.165 |
0.029 |
21.26 |
0.0002 (0.0010) |
-0.0002 (0.0013) |
|
Self-evaluation |
0.034 |
0.027 |
-0.007 |
-21.31 |
0.0002 (0.0011) |
-0.0001 (0.0015) |
REFERENCES
- Barabási, A.-L. (2013). Network science. Philosophical Transactions of the Royal Society A: Mathematical, Physical and Engineering Sciences, 371(1987), 20120375. https://doi.org/10.1098/rsta.2012.0375
- Biancani, S., & McFarland, D. A. (2013). Social networks research in higher education. In M. B. Paulsen (Ed.), Higher education: Handbook of theory and research (pp. 151–215). Springer.
- Blau, P. M., & Duncan, O. D. (1978). The American Occupational Structure. Free Press.
- Breiger, R. L. (1974). The duality of persons and groups. Social Forces, 53(2), 181–190. https://doi.org/10.2307/2576011
- Bruch, E., & Feinberg, F. (2017). Decision-making processes in social contexts. Annual Review of Sociology, 43(1), 207–227. https://doi.org/10.1146/annurev-soc-060116-053622
- Chakraborty, P., Mittal, P., Gupta, M. S., Yadav, S., & Arora, A. (2021). Opinion of students on online education during the COVID-19 pandemic. Human Behavior and Emerging Technologies, 3(3), 357–365. https://doi.org/10.1002/hbe2.240
- Christakis, N. A., & Fowler, J. H. (2010). Social network sensors for early detection of contagious outbreaks. PLOS One, 5(9), e12948. https://doi.org/10.1371/journal.pone.0012948
- Cimpian, J. R., Kim, T. H., & McDermott, Z. T. (2020). Understanding persistent gender gaps in STEM. Science, 368(6497), 1317–1319.
- Collins, R. (2019). The credential society: An historical sociology of education and stratification. Columbia University Press.
- Collins, R. (2020). Social distancing as a critical test of the micro-sociology of solidarity. American Journal of Cultural Sociology, 8(3), 477–497. https://doi.org/10.1057/s41290-020-00120-z
- Elias, J., Troop, D., & Wescott, D. (2021, September). Tracking colleges’ spring-reopening plans. The Chronicle of Higher Education. https://www.chronicle.com/article/tracking-college-spring-reopening-plans
- Ethier, K. A., & Deaux, K. (1994). Negotiating social identity when contexts change: Maintaining identification and responding to threat. Journal of Personality and Social Psychology, 67(2), 243.
- Feld, S. L. (1981). The focused organization of social ties. American Journal of Sociology, 86(5), 1015–1035.
- Festinger, L., Schachter, S., & Back, K. (1950). Social pressures in informal groups: A study of human factors in housing. Harper.
- Gardner, J., Brooks, C., & Li, W. (2018). Learn from Your (Markov) Neighbour: Co-Enrollment, Assortativity, and Grade Prediction in Undergraduate Courses. Journal of Learning Analytics, 5(3), 42–59.
- Goldin, C. D., & Katz, L. F. (2008). The race between education and technology. Harvard University Press.
- Griffith, A. L., & Rask, K. N. (2014). Peer effects in higher education: A look at heterogeneous impacts. Economics of Education Review, 39, 65–77.
- Huerta-Manzanilla, E. L., Ohland, M. W., & del Rocio Peniche-Vera, R. (2021). Co-enrollment density predicts engineering students’ persistence and graduation: College networks and logistic regression analysis. Studies in Educational Evaluation, 70, 101025.
- Israel, U., Koester, B. P., & McKay, T. A. (2020). Campus connections: Student and course networks in higher education. Innovative Higher Education, 45(2), 135–151. https://doi.org/10.1007/s10755-019-09493-x
- Kalmijn, M. (1998). Intermarriage and homogamy: Causes, patterns, trends. Annual Review of Sociology, 24(1), 395–421.
- Kizilcec, R. F., Baker, R. B., Bruch, E., Cortes, K. E., Hamilton, L. T., Lang, D. N., Pardos, Z. A., Thompson, M. E., & Stevens, M. L. (2023). From pipelines to pathways in the study of academic progress. Science, 380(6643), 344–347. https://doi.org/10.1126/science.adg5406
- Kingston, P. W., Hubbard, R., Lapp, B., Schroeder, P., & Wilson, J. (2003). Why education matters. Sociology of Education, 53–70.
- Lee, B., Lee, K., & Hartmann, B. (2023). Transformation of social relationships in COVID-19 America: Remote communication may amplify political echo chambers. Science Advances, 9(51), eadi1540.
- Lu, S., Zhao, J., & Wang, H. (2022). Academic failures and co-location social networks in campus. EPJ Data Science, 11(1), 10. https://doi.org/10.1140/epjds/s13688-022-00321-5
- Malik, J. K., Feinberg, F. M., & Bruch, E. E. (2025). From transcripts to trajectories: A framework for studying academic pathways through college. PNAS Nexus, 4(10), pgaf210. https://doi.org/10.1093/pnasnexus/pgaf210
- Martin, A. J., & Dowson, M. (2009). Interpersonal relationships, motivation, engagement, and achievement: Yields for theory, current issues, and educational practice. Review of Educational Research, 79(1), 327–365. https://doi.org/10.3102/0034654308325583
- Martin, N. D., Frenette, A., & Gualtieri, G. (2023). Campus connections for creative careers: Social capital, gender inequality, and artistic work. Poetics, 96, 101763.
- Mayer, A., & Puller, S. L. (2008). The old boy (and girl) network: Social network formation on university campuses. Journal of public economics, 92(1-2), 329–347.
- McPherson, M., Smith-Lovin, L., & Cook, J. M. (2001). Birds of a feather: Homophily in social networks. Annual Review of Sociology, 27(1), 415–444. https://doi.org/10.1146/annurev.soc.27.1.415
- Mishra, L., Gupta, T., & Shree, A. (2020). Online teaching-learning in higher education during lockdown period of COVID-19 pandemic. International Journal of Educational Research Open, 1, 100012. https://doi.org/10.1016/j.ijedro.2020.100012
- Morgan, S. L., Leenman, T. S., Todd, J. J., & Weeden, K. A. (2013). Occupational plans, beliefs about educational requirements, and patterns of college entry. Sociology of Education, 86(3), 197–217.
- Newcomb, T. M. (1961). The acquaintance process. Holt, Rinehart & Winston. https://doi.org/10.1037/13156-015
- Newman, M. E. J. (2003). Mixing patterns in networks. Physical Review E, 67(2), 026126. https://doi.org/10.1103/PhysRevE.67.026126
- Pokhrel, S., & Chhetri, R. (2021). A literature review on impact of COVID-19 pandemic on teaching and learning. Higher Education for the Future, 8(1), 133–141. https://doi.org/10.1177/2347631120983481
- Raabe, I. J., Boda, Z., & Stadtfeld, C. (2019). The social pipeline: How friend influence and peer exposure widen the STEM gender gap. Sociology of Education, 92(2), 105–123.
- Ramsey, L. R., Yu, W., Kling, T., & Kling, A. (2026). Classroom connections: A social network analysis of STEM students at a regional university. Journal of College Student Retention: Research, Theory & Practice, 27(4), 933–955.
- Small, M. L., & Adler, L. (2019). The role of space in the formation of social ties. Annual Review of Sociology, 45(1), 111–132.
- Stadtfeld, C., Vörös, A., Elmer, T., Boda, Z., & Raabe, I. J. (2019). Integration in emerging social networks explains academic failure and success. Proceedings of the National Academy of Sciences, 116(3), 792–797. https://doi.org/10.1073/pnas.1811388115
- Stevens, M. L., Armstrong, E. A., & Arum, R. (2008). Sieve, incubator, temple, hub: Empirical and theoretical advances in the sociology of higher education. Annual Review of Sociology, 34(1), 127–151.
- Thomas, R. J. (2019). Sources of friendship and structurally induced homophily across the life course. Sociological Perspectives, 62(6), 822–843.
- Tumminello, M., Miccichè, S., Lillo, F., Piilo, J., & Mantegna, R. N. (2011). Statistically validated networks in bipartite complex systems. PLOS One, 6(3), e17994. https://doi.org/10.1371/journal.pone.0017994
- Watts, D. J., & Strogatz, S. H. (1998). Collective dynamics of ‘small-world’ networks. Nature, 393(6684), 440–442. https://doi.org/10.1038/30918
- Weeden, K. A., & Cornwell, B. (2020). The small-world network of college classes: Implications for epidemic spread on a university campus. Sociological Science, 7, 222–241. https://doi.org/10.15195/v7.a9
- Weeden, K. A., Cornwell, B., & Park, B. (2021). Still a small world? University course enrollment networks before and during the COVID-19 pandemic. Sociological Science, 8, 73–82. https://doi.org/10.15195/v8.a4
- Weeden, K. A., Gelbgiser, D., & Morgan, S. L. (2020). Pipeline dreams: Occupational plans and gender differences in STEM major persistence and completion. Sociology of Education, 93(4), 297–314.
- Wentzel, K. R. (1999). Social-motivational processes and interpersonal relationships: Implications for understanding motivation at school. Journal of Educational Psychology, 91(1), 76–97. https://doi.org/10.1037/0022-0663.91.1.76
- Winston, G., & Zimmerman, D. (2004). Peer effects in higher education. In C. M. Hoxby (Ed.), College choices: The economics of where to go, when to go, and how to pay for it (pp. 395–424). University of Chicago Press.
- Zukin, S., & DiMaggio, P. (Eds.). (1990). Structures of capital: The social organization of the economy (Vol. 15). CUP Archive.